Geothermal Energy & Groundwater Protection – Flow Cytometry
Zurich Airport Ltd. is developing an Aquifer Thermal Energy Storage (ATES) system in a deeply buried glacial channel at a depth of approximately 300 m. The open-loop system is designed to store excess thermal energy in the aquifer during summer and recover it in winter. The performance and efficiency of such a system, in which groundwater is injected and abstracted at different temperatures, depend on complex interactions between groundwater, the subsurface, and the technical infrastructure.
A key aspect in the planning and optimization of ATES systems is understanding the microbial community of the aquifer. Microorganisms are a natural component of groundwater systems and contribute to the stability of subsurface ecosystems.
This study focused on characterizing the microbial community of the 300 m deep, water-bearing gravel aquifer and assessing its suitability for ATES operation. Online flow cytometry conducted during a pump–circulation test revealed total cell counts of approximately 50,000 cells/mL, comparable to values observed in shallow aquifers with drinking-water quality (Figure). The proportion of high-nucleic-acid (HNA) microorganisms - typically larger and more metabolically active bacteria - was high, at around 80%, which may indicate relatively large and well-connected pore spaces. However, it cannot be excluded that drilling, flushing, and pumping activities before and during the measurements introduced microorganisms or nutrients that temporarily affected microbial abundance and composition.
These data provide a first baseline for assessing pre-operational conditions and form a foundation for developing strategies to ensure long-term efficiency and operational reliability of the ATES system.
Commissioned by: Zurich Airport Ltd.
Project duration: 2024 – 2025
Michel Walde, Oliver Schilling & Jannis Epting
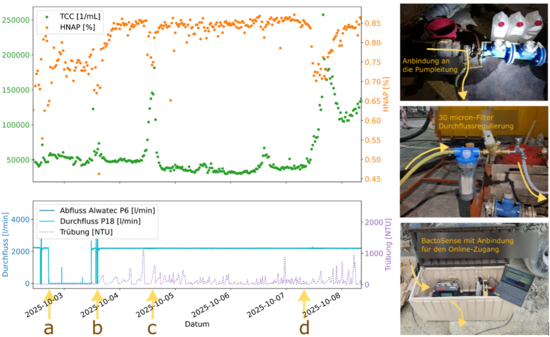
Figure: Left: Time-resolved measurement results from the third measurement campaign. Total cell counts (TCC), large/easily marked cells (HNA) and time series of flow and turbidity in the pump line are shown. Right: Setup and connection of the measuring instruments.
Quick Links
Social Media