Regional-Scale Thermal Hydraulic Modeling for Preliminary Geothermal Potential Assessment – Pilotstudy Riehen
A Theoretical Approach using the example of Riehen
Stefan Scheidler, Horst Dresmann & Jannis Epting
Based on the approach of Tóth et al. (2020), we demonstrate how conceptual, generalized, and simplified Thermal Hydraulic Models (THM) can be used to simulate groundwater flow and heat transport and to support the identification of potential areas for the planned new medium-depth geothermal wells in the municipality of Riehen, Northwestern Switzerland.
Regional-scale 2D THM were developed using COMSOL© based on geological section interpretations followed by an assessment of the influence of geological structures as well as the sensitivity of hydraulic and thermal parameters and boundary conditions. Preliminary modeling results show that the thermal regime can be modelled relatively accurately and reproduces measured temperature data (Figure). Furthermore, the most sensitive geologic units and parameters could be identified, which are faults (k-value and aperture) and aquitard (k-value, thermal conductivity) whereas the hydraulic parameters of aquifers have been recognized as not very sensitive.
The next step would be to use the gained experience and to update our existing high-resolution regional 3D geologic model, augment it with the recorded 3D seismic data, and develop a 3D THM. Information on 3D geothermal potential and groundwater flow regime would allow optimization of the location of production and injection wells for an efficient long-term use and to address groundwater protection issues already in the exploratory phase.
REFERENCES: Tóth, A., Galso, A., Mádl-Szőnyi, J. (2020) “Significance of basin asymmetry and regional groundwater flow conditions in preliminary geothermal potential assessment – Implications on extensional geothermal plays”, Global and Planetary Change 195. DOI: doi.org/10.1016/j.gloplacha.2020.103344
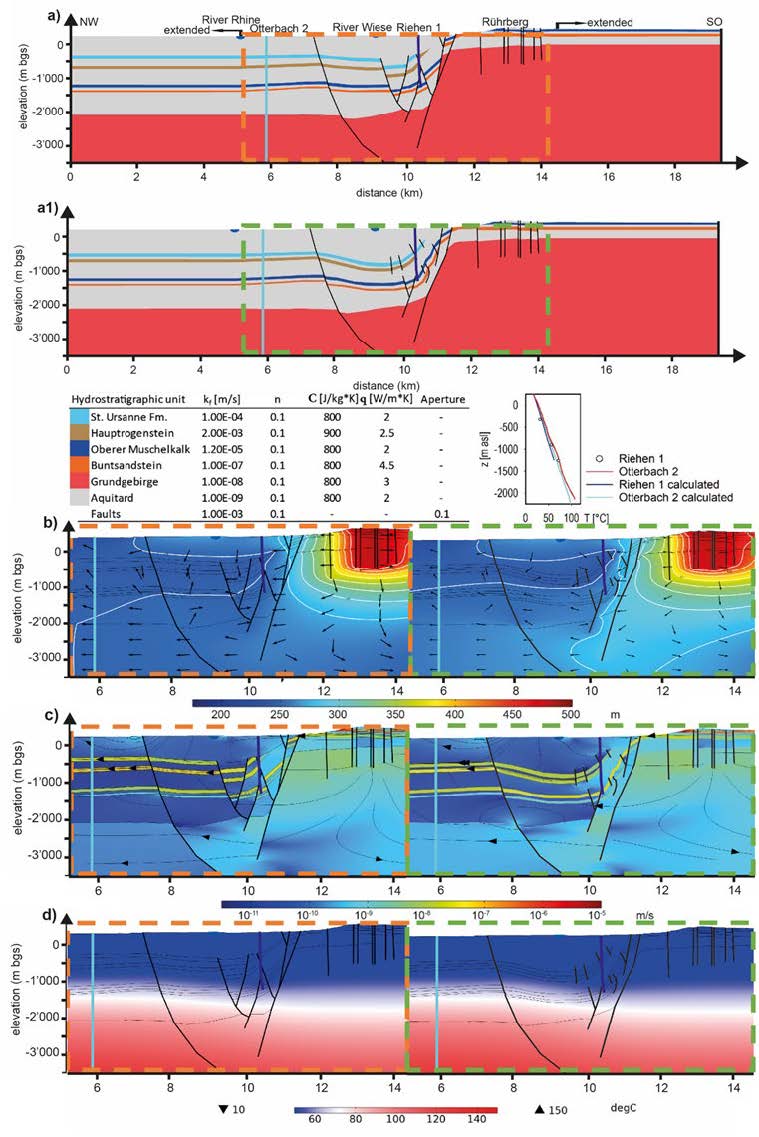
Regional-scale 2D THM: a) geologic profile extended on both sides to avoid boundary effects; b) simulated groundwater flow and thermal regime showing the hydraulic head and uniform Darcy velocity vector field; c) Darcy velocity magnitude with characteristic streamlines; d) simulated temperature field. The graph shows the measured and calculated vertical temperature profiles from the deep borehole Otterbach 2 in Basel and the existing geothermal well Riehen 1.
Quick Links
Social Media